The Dollar Profits to Insider Trading
Peter Cziraki, Jasmin Gider
Review of Finance, Volume 25, Issue 5, September 2021, Pages 1547–1580, https://doi.org/10.1093/rof/rfab010
The notion that corporate insiders possess more information about their firm than outside investors plays an important role in models of financial markets. The empirical literature uses the abnormal returns to publicly reported insider trades to measure insiders’ informational advantage and finds that such returns are economically large. Prior work has used abnormal returns both to establish trading strategies that generate alpha and to capture insiders’ private benefits as a proxy for agency issues. However, if insiders face constraints to capitalizing on private information, the determinants of abnormal returns (as a measure of superior information) and the determinants of who capitalizes on private information (generating high profits) can differ.
We present stylized facts about dollar profits, contrast them with percentage returns, and investigate mechanisms to explain the discrepancy between returns and profits. Our main finding is that quantities matter: returns and dollar profits paint a markedly different picture of insider trading, because insiders who make high returns tend to place small and infrequent trades.
We show that dollar profits are small for the typical corporate insider. The median insider who trades in a given year earns annual abnormal profits of $464, while the average insider earns $12,000 per year.
We also show that high percentage returns do not imply high dollar profits. The correlation between dollar profits and returns is only 22-23%, and markedly lower, only 4-5% for abnormal returns above 0.5%, which approximately corresponds to the top tercile. Dollar profits to insider trading are small partly because insiders with the most informative trades, earning large abnormal returns, tend to trade infrequently and in relatively modest amounts. The correlation between dollar profits and percentage returns is moderate because returns are negatively correlated with trade size and frequency.
These correlations vary with proxies for insider preferences, firm-level monitoring, and regulatory scrutiny. The correlation between returns and trade size is lower for insiders who have been with the firm for a longer time, those with a high ownership stake, for local insiders, and those that report their trades in a timely fashion. The correlation is also lower for insiders of firms with high institutional ownership, larger firms, and those covered by security analysts. Finally, the correlation is significantly lower after the passage of the Sarbanes-Oxley Act (SOX), and in years when the SEC’s budget is higher.
We present three empirical implications of the differences between high-return and high-quantity insiders. First, informed trading proxies established by the existing literature are negatively correlated with trade quantities, and hence, with yearly dollar profits, even though they are positively correlated with percentage returns, by definition. Second, insiders making the highest profits are different from those making the highest returns. The third implication is that dollar profits predict future returns to insider trades because they proxy for insider preferences. Insiders in the top quintile of yearly dollar profits in one year earn 21bps lower abnormal returns in the following year.
Our work suggests that dollar profits are a better measure for corporate governance applications of insider trading.
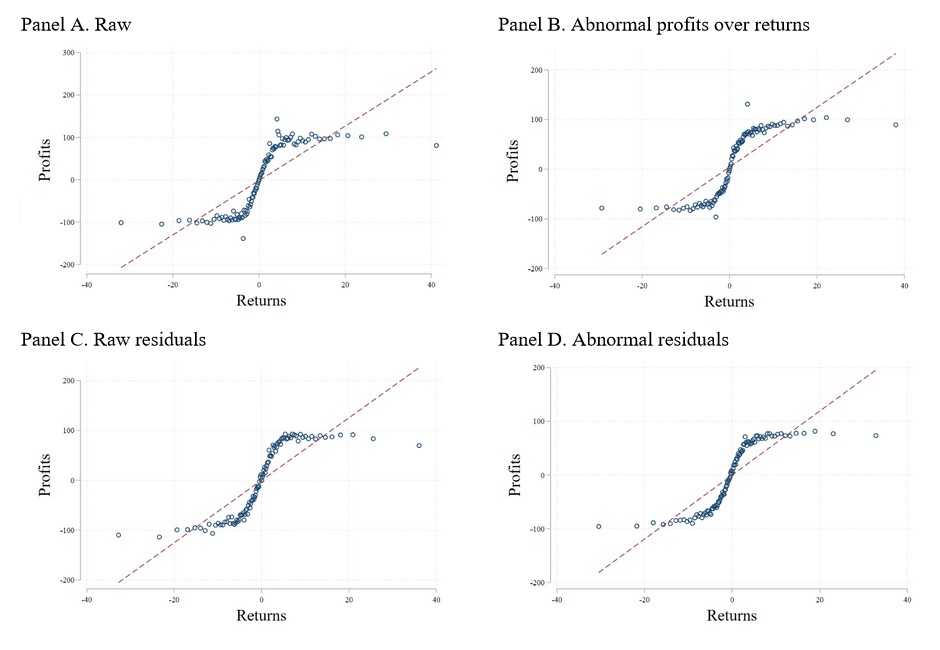
Figure: The Relation Between Returns and Profits.
The figure plots the average profits over 100 equally-sized groups based on returns. Panel A (B) plots raw (abnormal) profits over raw (abnormal) returns. Panel C (D) plots the residuals of a regression of raw (abnormal) profits on time-varying firm characteristics (log of market capitalization, log of number of analysts following the firm, book-to-market ration and idiosyncratic volatility), firm fixed effects and year fixed effects over the 100 equally-sized groups of residuals of a regression of raw (abnormal) returns on the same control variables and fixed effects. The dashed line plots the linear regression fit. Dollar quantities are inflation-adjusted and expressed in 2013 U.S. dollars.