The lead article in Volume 21, Issue 4 of the Review of Finance is “What Are the Best Liquidity Proxies for Global Research?” by Kingsley Fong of the University of New South Wales and Craig Holden and Charles Trzcinka of Indiana University.
What is Liquidity?
Liquidity – the ease at which an asset can be traded – is central to finance and has far-reaching consequences in both asset pricing and corporate finance. For example, if a stock or bond is illiquid, an investor needing to raise funds may only be able to sell it at fire-sale prices – if at all – and may go bankrupt, as in the financial crisis. Furthermore, expecting future illiquidity, an investor may not buy the stock or bond to begin with, even if the issuer has valuable investment opportunities that it needs to fund – so capital allocation breaks down.
Relatedly, if shares are illiquid, then investors know that it will be difficult to trade on information, thus discouraging them from gathering information to begin with. As a result, share prices become uninformative, preventing managers and stakeholders from using them as signals, and reducing the effectiveness of stock-based compensation. Shareholders will find it hard to acquire large stakes, thus leading to fragmented ownership and exacerbating the separation of ownership and control.
Measuring liquidity is thus crucial. But, most liquidity measures are based on intraday trade and/or quote data and are thus computationally very intensive, with thousands of trades and quote updates occurring in a single day. This is particularly a problem for corporate finance applications, which ideally use long panels of data, and global studies, since intraday data is expensive, very large, and growing exponentially over time.
This paper aims to solve this problem by showing researchers that they can use “liquidity proxies,” defined as measures based on daily data, that perform close-to-as-well as “liquidity benchmarks,” defined as measures based on intraday data. Liquidity proxies can offer 1,000× to 10,000× computational savings. There are two main contributions of the paper. The first is to evaluate how correlated liquidity proxies are with liquidity benchmarks at both monthly and daily frequencies, in order to see which monthly and daily liquidity proxies are the best approximations for global research. The second is to introduce a new liquidity proxy – the FHT measure – that is even simpler to calculate than existing ones but performs just as well as the best existing measures.
Liquidity Benchmarks Based On Intraday Data
The authors start by defining the liquidity benchmarks based on intraday data that they will use to compare the liquidity proxies.
(Il)liquidity measures the cost of trading an asset. This cost can be calculated relative to either the price of the asset or the dollar volume being traded. There are thus two categories of liquidity benchmarks:
(1) Percent-Cost Benchmarks
The most intuitive benchmark is the percent quoted spread, which is the bid-ask spread scaled by its midpoint, i.e. |Ask – Bid| / Midpoint, where Midpoint is half-way between Ask and Bid. This is calculated using the best Ask and Bid quotes available at the end of every second during regular trading hours. Then, it can be averaged up across all seconds within a day or month to obtain a daily or monthly benchmark – but calculation of this benchmark requires intraday data.
One difficulty with percent quoted spread is that trades may not actually occur at the Ask and Bid prices – for example, large orders typically trade at multiple prices, including some that are above the Ask or below the Bid. Conversely, trades may take place between the displayed Ask and Bid if there are hidden orders at those prices. The percent effective spread is |Price – Midpoint| * 2 / Midpoint, where Price is the price at which a trade is actually executed. While the percent quoted spread is averaged up across seconds, the percent effective spread is calculated for a particular trade, and then averaged up across all trades within a day or month.
A third benchmark is the percent realized spread, which is the temporary component of the spread. It is the same as the percent effective spread, except that the midpoint is 5 minutes after the trade. A fourth is the percent price impact, which is the permanent component of the spread – the percentage change in Midpoint over a 5-minute interval.
(2) Cost-Per-Dollar-Volume Benchmarks
The cost-per-dollar-volume benchmark that the authors use is “lambda”. Introduced in the famous Kyle (1985) trading model, lambda measures how prices respond to order flow. Empirically, it can be estimated by regressing the stock return on the signed square root of order flow, where both are measured over a 5-minute period. It is then averaged up over all 5-minute intervals to form a daily or monthly benchmark.
Liquidity Proxies Based On Daily Data
These measures are calculated using daily data and aggregated to monthly or daily intervals. There are two matching categories of liquidity proxies:
(1) Percent-Cost Proxies
A starting point is the LOT measure from Lesmond, Ogden, and Trzcinka (1999). The intuition is that, if transactions costs are high, then investors will not trade on a given day, and so the stock return will be zero. A zero-return day is defined as one where the stock price does not change from the previous day. Thus, the proportion of zero-return days signals high transactions costs, i.e. low liquidity. For a stock with a high beta and high idiosyncratic risk, a zero return day is a much stronger signal of high transactions costs, because such a stock should naturally move considerably more than a low beta and low idiosyncratic risk stock.
Thus, the LOT measure is increasing in the proportion of zero returns, beta, and idiosyncratic volatility of returns. The related LOT Y-Split measure is based on a similar intuition.
The authors introduce a new measure, the FHT measure, by simplifying the LOT model in two ways. First, it assumes that transactions costs and symmetric. Second, it focuses on the return distribution of an individual stock and provides no role for the market portfolio, which removes the need to have to estimate the stock’s beta. The FHT measure can thus be calculated as
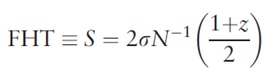
where “sigma” is the standard deviation of daily returns over a month, z is the proportion of zero return days in that month, and N is the normal distribution function. The FHT measure can be calculated 1,000 times faster than LOT, with a single line of SAS code. (Indeed, due to its substantial convenience, I use it in one of my own papers.)
The authors also test many other percent-cost proxies from the existing literature, such as the Effective Tick, Extended Roll, High-Low, and Closing Percent Quoted Spread.
(2) Cost-Per-Dollar-Volume Proxies
The authors test many cost-per-dollar-volume proxies from the existing literature. One proxy is the Amihud (2002) measure, which is the ratio of the absolute value of stock returns to dollar volume, averaged over a month. Another proxy is the Pastor and Stambaugh (2003) proxy, which regresses yesterday’s signed volume on today’s excess stock return above the market return in order to measure the degree of reversal of the previous day’s order flow shock. They also test nine existing Extended Amihud proxies, the Roll Impact, Extended Roll Impact, Effective Tick Impact, LOT Mixed Impact, LOT Y-Split Impact, Zeros Impact, Zeros2 Impact, High-Low Impact, Closing Percent Quoted Spread Impact, plus a tenth new one – FHT Impact – based on dividing the new FHT measure by average daily volume.
The measures described above are computed using daily data and aggregated to form monthly or daily proxies. Specifically, the authors calculate daily versions of two percent-cost proxies (High-Low and Closing Percent Quoted Spread) and daily versions of four cost-per-dollar-volume proxies (Amihud, Amivest, Closing Percent Quoted Spread Impact, and High-Low Impact).
Measuring Performance
The authors compute liquidity proxies and benchmarks for thousands of firms on 42 exchanges around the world over 19 years. They have four methods of gauging the performance of liquidity proxies:
• Higher cross-sectional correlation with the liquidity benchmarks.
• Higher portfolio time-series correlation with the liquidity benchmarks.
• Higher individual stock time-series correlation with the liquidity benchmarks.
• Lower average root mean squared error relative to the liquidity benchmarks.
Results
The authors find the following results for global research:
• The Closing Percent Quoted Spread is the best monthly percent-cost proxy when available.
• Amihud, Closing Percent Quoted Spread Impact, LOT Mixed Impact, High-Low Impact, and FHT Impact are tied as the best cost-per-dollar-volume proxy.
• The daily version of Closing Percent Quoted Spread is the best daily percent-cost proxy.
• The daily version of Amihud is the best daily cost-per-dollar-volume proxy.