Measuring Climate Transition Risk Spillovers
Runfeng Yang, Massimiliano Caporin, Juan-Angel Jiménez-Martin
Review of Finance, Volume 28, Issue 2, March 2024, Pages 447–481, https://doi.org/10.1093/rof/rfad026
In this paper, we study the spillover of climate transition risk: we intend to measure how much and to what extent the climate transition risk can spread across borders.
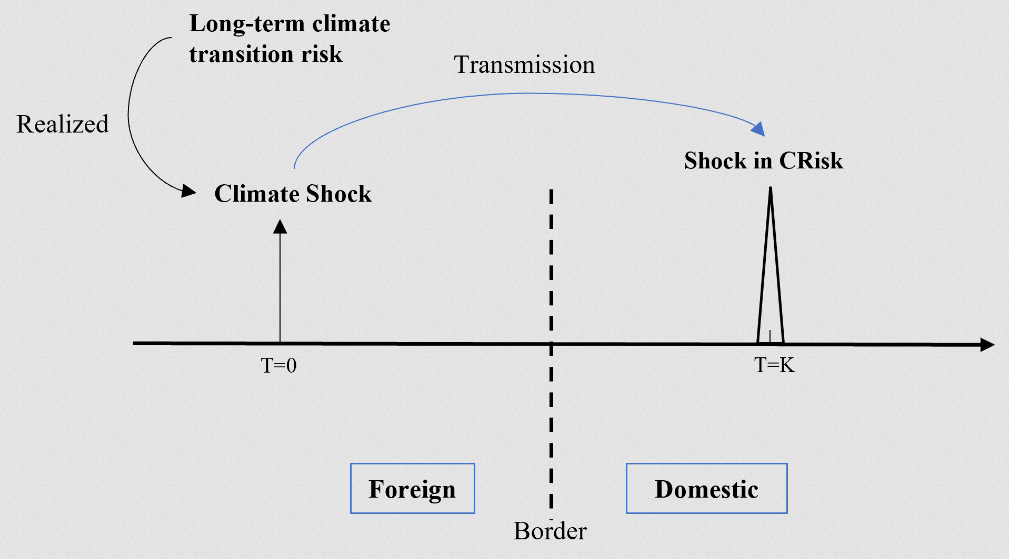
We propose a new indicator for the climate transition risk based on price movements in the financial markets: the unexpected changes in the carbon risk premium. Climate transition risk shocks (such as new climate policies) will change investor expectations/beliefs in companies and result in carbon risk premium changes. Subsequently, such changes in the risk premium can be used as an indicator for the climate transition risk, which we refer to as “CRisk series”. With the new indicator, the transition risk spillover is measured by estimating the interaction of CRisk series among different markets.
Two types of shocks are considered: extreme positive and negative shocks. Extreme positive transition risk shocks are associated with a strengthening of climate policies or extreme local weather events; extreme negative transition risk shocks are related to weaker climate policies or a reduced concern over global warming.
The discussion is divided based on the transmission timing: simultaneous and non-simultaneous. Simultaneous transmission refers to the contemporaneous co-movement in the CRisk of different markets, and non-simultaneous transmission is the predictive relationship between CRisk series. The predictability/co-movement among CRisk series implies that local investors update their beliefs not just based on local climate event information but also on foreign information. We study the spillover of climate transition risk among six major markets: the United States, China (including Hong Kong), Europe (including the UK), Canada, Australia and Japan, with a sample period from 2013 to 2021.
Regarding the simultaneous transmission, we found that common shocks affecting all markets could be attributed to both local and global events. The main channel for this can be the transmission of information, and it can explain up to 50% of the variation in some markets.
As for the non-simultaneous transmission, we find that, with different pairs of markets, it takes different periods for risks to spillover. In most cases, the risk transmits within six weeks. Also, the risk spillover is asymmetric – positive shocks and negative shocks have different spillover patterns. Larger shocks are more likely to be affected by foreign shocks as well as by more recent shocks.
In terms of possible channels of non-simultaneous transmission, economic ties between countries play a significant role. In addition, greater bilateral financial flows correspond to increased transition risk spillover, which implies that the integration of global markets also contributes to this phenomenon. Furthermore, economic sectors, while influencing the shock’s transmission, only have a minimal impact.
In the long run, around 50% of extreme local shocks come from outside. The level of spillover is higher for negative shocks than for positive shocks. The economic background of climate shocks is important in determining the risk spillover pattern. As a result, the role of risk spillover for one market could change over time. This changing role across time is mainly due to changes in the size of local shocks.