Margin Trading and Comovement During Crises
Bige Kahraman, Heather Tookes
Review of Finance, Volume 24, Issue 4, July 2020, Pages 813–846, https://doi.org/10.1093/rof/rfz019
In this paper, we exploit threshold rules governing margin trading eligibility in India to identify a causal link between margin trading and increased comovement during crises. Like other stock markets around the world, Indian equity markets are characterized by return comovement that tends to increase during downturns. Indian equity markets are an ideal laboratory for examining the impact of margin trading on comovement because only some exchange-traded stocks are eligible for margin trading. Importantly, eligibility is based on a well-defined cutoff. Figure 2, Panel D shows return comovement for the subsample of Group 1 and Group 2 stocks that are close to the margin eligibility threshold of 1. Stocks to the left of the threshold are eligible for margin trading and those to the right are ineligible. The figure shows comovement both during severe downturns and outside of them. From the figure, there is a clear discontinuous jump in comovement at the eligibility threshold during severe downturns. Margin-eligible stocks experience greater comovement than ineligible ones during downturns. There is no such jump outside of downturn periods. The figure provides simple, yet striking, evidence consistent with the hypothesis that funding constraints in bad times drive comovement.
In the formal analysis, we implement a regression discontinuity design and we find that margin trading explains more than one quarter of the increase return comovement that we observe during crises. To understand the mechanisms driving this result, we evaluate the relative importance of stock connections through common brokers (who provide margin financing) versus common margin traders. We find that common brokers are most important. Margin-eligible stocks that are more connected through common brokers experience larger crisis-period increases in pairwise return comovement, especially when those brokers’ clients have experienced recent portfolio losses, when their clients have outstanding margin loans in more volatile stocks, and when the brokers are large. These findings are consistent with Brunnermeier and Petersen (2009), in which initial shocks propagate due to the tightening of margin constraints imposed by financial intermediaries.
Figure 2, Panel D
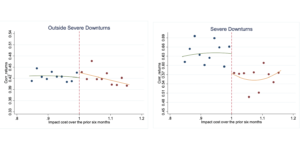
The figures plot the average return comovement during month t as a function of impact cost over the previous six months (which determines month t eligibility). The comovement measure is corr_returns, which is defined as the month t correlation of stock i’s daily returns with the (equal-weighted) average daily market returns. Stocks are divided into equally sized bins (the X axis) on each side of the eligibility cutoff of 1%. The figures show the average comovement within each bin. The number of bins (10) is chosen based on the F-test procedures described in Lee and Lemieux (2010). Margin eligible stocks are all those stocks with impact costs that are less than or equal to 1%, and are located to the left of the vertical line. “Severe downturns” refers to months in which market returns are below the 10th percentile returns.