Trading Volume and Time Varying Betas
Christopher Hrdlicka
Review of Finance, Volume 26, Issue 1, February 2022, Pages 79 – 116, https://doi.org/10.1093/rof/rfab014
Asset’s risks change overtime. These changes are central to understanding price dynamics. I show that these risk changes also drive trade.
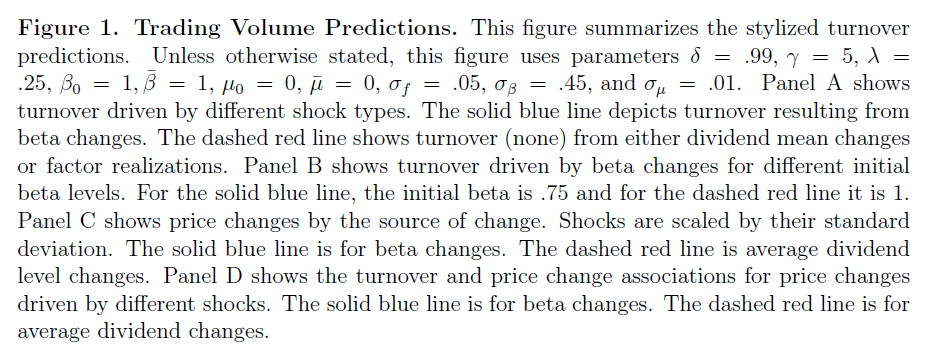
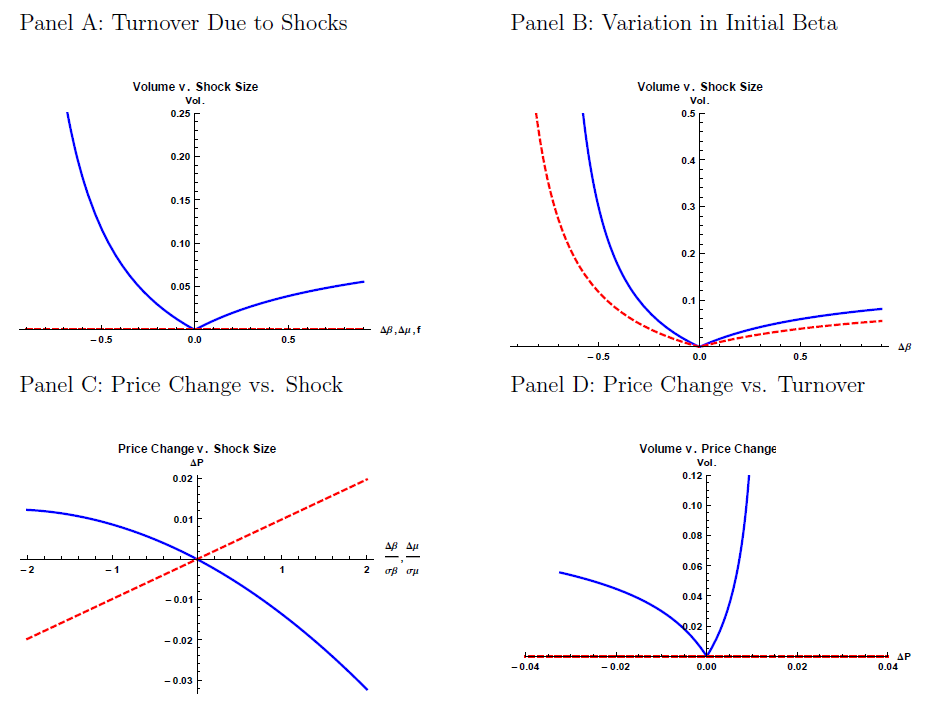
Trade arises from investors rebalancing to offset these risk exposure changes to maintain their risk level targets. Maintaining their targets requires more trade when the risk exposure of an asset falls than when its risk increases. For example, a stock with a beta of one-half requires twice as much trade as does a stock with a beta of one to change portfolio risk exposure by one unit. Panel A illustrates this asymmetric relation between trade and risk changes. A similar effect makes trade in stocks with smaller initial risk exposures more sensitive to risk changes, as illustrated in Panel B.
The need to trade does not diversify away in large portfolios, because failing to trade exposes investors to unnecessary and uncompensated idiosyncratic risk. Theoretically transaction costs could outweigh the benefit of this rebalancing. However, the data confirm the predicted relationship, and that it has strengthened as transaction costs have decreased.
On average a one standard deviation fall in a stock’s market beta raises turnover by as much as 25%. Changes in market betas explain as much as 5% of the monthly cross-sectional variation in turnover. As transaction costs have fallen this relation has strengthened. Changes in SMB and HML exposures also drive trade as should changes to any risk exposure priced or unpriced that investors care about. The generality of the rebalancing need when risk exposures change, makes these estimates lower bounds on the importance of risk changes for understanding trade. Trade is generated by other sources too, such as differences in investor risk aversion, outside income or opinions. All of these are amplified by changing risk exposures.
That the same underlying shock to risk moves both prices (see Panel C) and trade produces a positive correlation between trading volume and absolute changes price. Panel D illustrates how the previously discussed asymmetry propagates to the price and volume relationship. This asymmetry matches the patterns documented in the literature.
Not all price changes are driven by risk changes. Some are driven by changes to cash flows. In contrast to what we see for risk changes, we expect little trade from shocks to cash flow levels. Why? Investors all prefer more dividends and prices must adjust to offset increased (decreased) demand for a stock after positive (negative) shock, e.g., the no trade theorem. The different trade patterns are illustrated with solid (blue) and dashed (red) lines in Panel D. This observation means that the amount of trade accompanying a price change can illuminate its cause. Vector auto regressions confirm this prediction: turnover is more strongly associated with discount rate news than cash flow news. Consequently, trading volume helps predict returns: more trading volume accompanying a price change increases the likelihood of its reversal out to a horizon of three year.
Figure 1: