Andreas Johansson, Riccardo Sabbatucci, Andrea Tamoni
Review of Finance, Volume 29, Issue 1, January 2025, Pages 103–139, https://doi.org/10.1093/rof/rfae034
We construct tradable risk factors for institutional and retail investors by combining large, liquid mutual funds for the long leg and ETFs for both long and short legs. Our study reveals that neither retail nor institutional investors can effectively track the standard “on-paper” size, value, momentum, profitability, and investment factors.
When we compare the performance of our tradable factors to the “on-paper” factors, we find an annual performance gap of 2% to 4%. We term this discrepancy the implementation shortfall (IS), drawing from the terminology of Perold (1988) and Pedersen (2015). The IS encompasses both trading costs (TC) and the opportunity costs (OC) associated with trading adjustments aimed at minimizing transaction costs in practical scenarios. We quantify the portion of the IS attributed to TC, and infer the opportunity cost of not trading the exact “on-paper” portfolio as the difference between IS and TC.
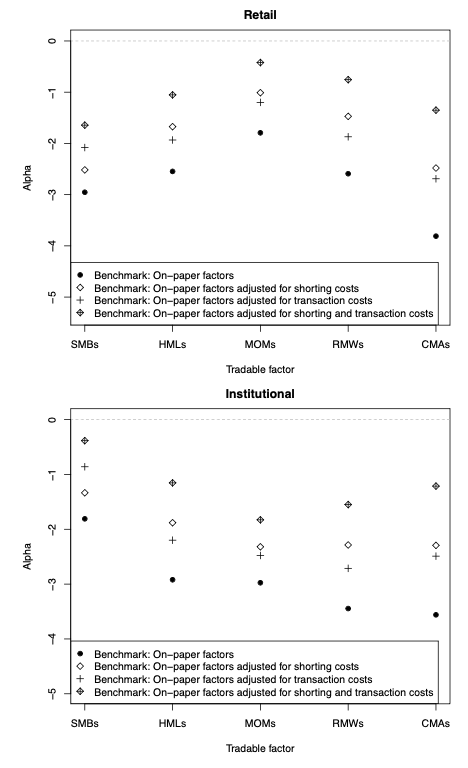
Our construction of tradable factors takes into account not only trading, but also shorting costs, which play a crucial role in explaining the implementation shortfall. Interestingly, tradable factors tend to have lower shorting fees than their “on-paper” counterparts. Thus, shorting costs play a crucial role in explaining the implementation shortfall. When accounting for shorting fees in the “on-paper” factors, the gap between tradable and “on-paper” factors narrows. This is illustrated in Figure 1 where the squared symbols (“on-paper” factors net of shorting fees) are closer to zero compared to the filled circles representing standard Fama-French factors. In essence, accounting for shorting fees in the Fama-French factors reduces the implementation shortfall.
We further investigate the contribution of trading costs to the IS between our tradable factors and the “on-paper” factors. Although our tradable factors already reflect the trading costs of individual securities held by the funds—costs implicitly accounted for in realized fund returns—the “on-paper” factors do not. However, “on-paper” factor portfolios, which comprise hundreds of stocks and experience high turnover, incur significant trading costs. Our findings indicate that the IS is reduced more significantly when accounting for shorting costs rather than trading costs. For instance, focusing on institutional investors, we observe that the alphas for HML and MOM decrease by 36% and 22% (in absolute value), respectively, when accounting for shorting costs, compared to reductions of 25% and 17% when accounting for trading costs.Overall, shorting fees and transaction costs contribute to 58% of the performance differential between tradable and “on-paper” factors. As shown in Figure 1, the remaining alphas – interpreted as an opportunity cost of not trading the exact “on-paper” portfolio, highlight additional frictions, such as the illiquidity of many stocks in the short leg of the “on-paper” factors, that are accounted for when using funds.
Overall, our analysis underscores a substantial performance gap between tradable risk factors, constructed using large and liquid mutual funds and ETFs, and the widely used “on-paper” factors.
Figure: Performance gap between tradable and Fama-French “on-paper” factors considering the impact of trading and shorting costs.
