The Duration Puzzle in Life-Cycle Investment
Servaas van Bilsen, Ilja A Boelaars, A. Lans Bovenberg
Review of Finance, Volume 24, Issue 6, November 2020, Pages 1271–1311, https://doi.org/10.1093/rof/rfaa009
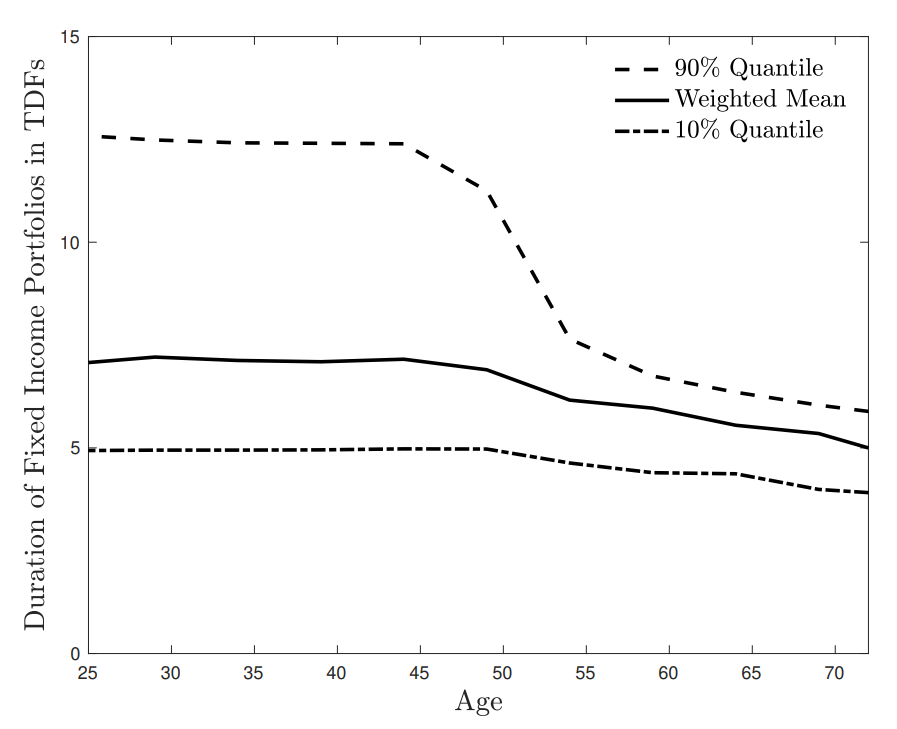
Figure 1. Duration of fixed income portfolios in TDFs. The figure illustrates the (weighted) mean (solid line), the (weighted) 10% quantile (dash-dotted line) and the (weighted) 90% quantile (dashed line) of the modified duration of fixed income portfolios in TDFs in 2019 as a function of age. The age on the horizontal axis is chosen such that the target date corresponds to age 65. Note that a TDF typically remains open when the target date is reached.
The figure reveals a striking pattern: the average interest rate duration of Target Date Fund (TDF) portfolios is flat over the life-cycle. This pattern cannot be reconciled with classical portfolio theory which predicts that the interest rate duration of a TDF portfolio should decrease with the investor’s age. We call the fact that observed durations of TDF portfolios are inconsistent with the theoretically predicted durations the duration puzzle. This paper investigates to what extent several extensions of classical portfolio theory can explain the duration puzzle. More specifically, we consider the impact of human capital, inflation risk and portfolio restrictions on the duration of the optimal portfolio. We find that it is difficult to explain the duration puzzle, especially for individuals aged between 35 and 65.