An Augmented q-Factor Model with Expected Growth
Kewei Hou, Haitao Mo, Chen Xue, Lu Zhang
Review of Finance, Volume 25, Issue 1, February 2021, Pages 1–41, https://doi.org/10.1093/rof/rfaa004
In the investment theory, firms with high expected investment growth should earn higher expected returns than firms with low expected investment growth, holding current investment and profitability constant. Intuitively, if expected investment is high next period, the present value of cash flows from next period onward must be high. Consisting mainly of this present value, the benefit of current investment must also be high. As such, if expected investment is high next period relative to current investment, the current discount rate must be high to offset the high benefit of current investment to keep current investment low.
We estimate expected growth via cross-sectional forecasting regressions of investment-to-assets changes on current Tobin’s q, operating cash flows, and changes in return on equity. Independent 2 by 3 sorts on size and expected growth yield an expected growth factor, with an average premium of 0.84% per month (t = 10.27) and a q-factor alpha of 0.67% (t = 9.75).
We augment the q-factor model (denoted “q”) with the expected growth factor to form the q5 model (“q5”). We then perform a large-scale horse race with other recent factor models, including the Fama-French (2018) 6-factor model (“FF6”) and their alternative 6-factor model (“FF6c”), in which the operating profitability factor is replaced by a cash-based profitability factor, as well as several other factor models. As testing portfolios, we use the 150 anomalies that are significant (|t| >= 1.96) with NYSE breakpoints and value-weighted returns from January 1967 to December 2018. The large set includes 39, 15, 26, 40, and 27 across the momentum, value-versus-growth, investment, profitability, and intangibles categories.
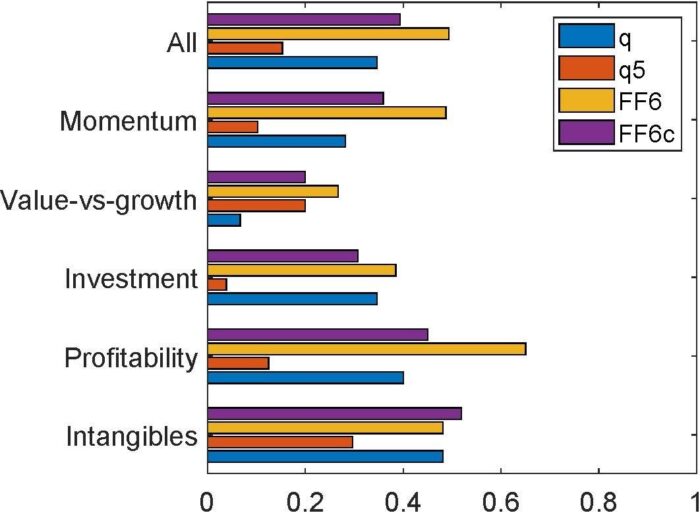
The q5 model is the best performing model. Figure 1 shows the fractions of significant alphas across all and different categories of anomalies. Across all 150, the q5 model leaves 15.3% significant, a fraction that is lower than 34.7%, 49.3%, and 39.3% across the q, FF6, and FF6c model, respectively. The q5 model is also the best performer in each of the categories. In particular, in the momentum category, the fraction of significant alphas in the q5 model is 10.3%, in contrast to 28.2%, 48.7%, and 35.9% across the q, FF6, and FF6c model, respectively. And in the investment category, the fraction of significant alphas in the q5 model is 3.9%, in contrast to 34.6%, 38.5%, and 30.8% across the q, FF6, and FF6c model, respectively.
In terms of economic magnitude, across the 150 anomalies, the average magnitude of the high-minus-low alpha in the q5 model is 0.19% per month, which is lower than 0.28%, 0.3%, and 0.27% across the q, FF6, and FF6c model, respectively.
While bringing expected growth to the front and center of empirical asset pricing, we acknowledge that the (unobservable) expected growth factor depends on our specification, and in particular, on operating cash flows as a predictor of future growth. While it is intuitive why cash flows are linked to expected growth, we emphasize a minimalistic interpretation of the q5 model as an effective tool for dimension reduction.